Much of what is written in theparallel Gold Market update is equally applicable to silver and it will not be repeated here.
Although silver has picked up significantly since its March low it has greatly underperformed gold over the past 2 years, but this is normal during the earliest stages of a major sector bullmarket when gold is favored over silver. On its 20-year chart we can see that silver remains stuck within a giant base pattern that started to form as far back as 2013. This chart makes clear that once gold breaks out to new highs against the dollar, then silver should break out of this base to enter a dynamic advancing phase.
在平行黄金市场更新中所写的许多内容同样适用于白银,在这里不会重复。
尽管银价已从3月低点大幅上扬,但在过去两年表现远逊于黄金,但在主要行业牛市的最初阶段,这是正常的,当时的黄金较白银更受青睐。在其20年的图表中,我们可以看到银价仍然停留在早在2013年就开始形成的前底模式中。这张图表清楚地表明,一旦黄金相对美元突破新高,那么白银应该突破这个基础进入一个动力前进的阶段。

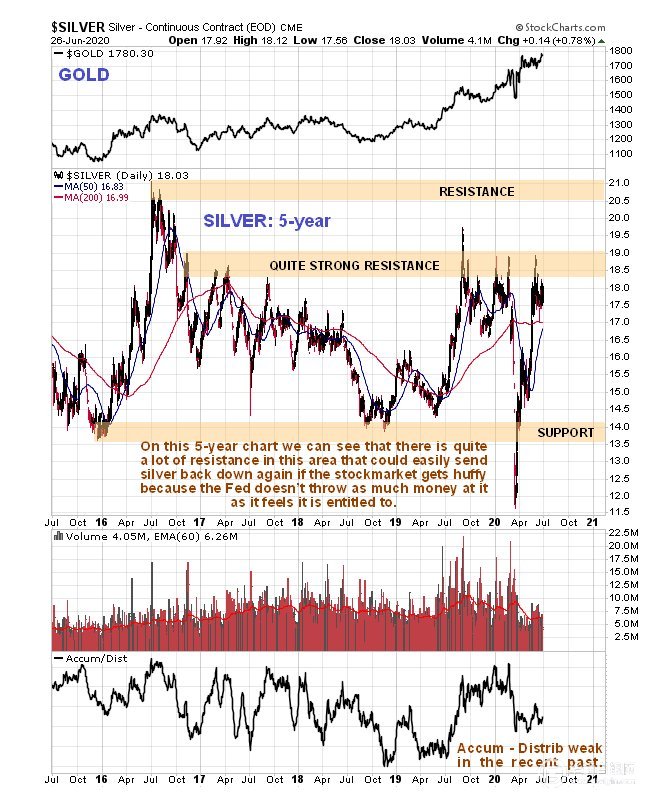
The 5-year chart reveals that silver is battling a lot of resistance in this zone, so if gold should back off soon for whatever reason, like the stockmarket dropping hard, then it will likely drop back for a while too. Here we should note that if the stockmarket does go into another downwave soon then the Fed can be expected to print up another couple of trillion to drive it back up again, which will be hyperinflationary and very bullish for gold and silver. Keep in mind that if the Fed (or its proxies) wade in here buying stocks they can head off any decline and get it moving higher again.
5-vear图显示,银价在该区域与许多阻力作斗争,因此,如果黄金投资者因某种原因很快退出市场,比如股市暴跌,那么它可能也会下跌一段时间。这里我们应该注意到,如果股市真的很快进入另一波下行浪潮,那么美联储可能会再次印钞数万亿美元,将其推高,这将导致恶性通胀,对黄金和白银非常有利。请记住,如果美联储(或其代理)介入,买入股票,他们可以阻止下跌,并推动股市再次走高。

The 2-year chart for silver with the S&P500 index shown at the top is useful as it makes clear that there is a crude but important correlation between silver and the stockmarket, which can be expressed bluntly as “when the stockmarket tanks it takes silver with it”. The message from this chart is thus clear – if the stockmarket continues to advance courtesy of continued Fed pumping, then there is a good chance that silver will break out of its base pattern, but if the Fed “falls down on the job” and the stockmarket tanks again, so will silver. Big Money doesn’t care about either the economy or the unemployed – all it cares about is the stockmarket and how much it can make out of deals etc. On this chart we see that although silver’s overbought condition has neutralized in recent weeks putting it theoretically in position to break out of its giant base, there is a lot of resistance above the current price that we can expect to turn it down if the stockmarket weakens.
这张顶部标普500指数的两年白银图表很有帮助,因为它清楚地表明白银和股市之间存在一种粗略但重要的关联,这可以直截了当地表达为“当股市崩溃时,白银也会随之下跌”。从这张图表中得到的信息是如此清楚——如果股市在美联储的持续推动下继续上涨,那么白银很有可能会突破其基本模式,但如果美联储“工作失败”,股市再次崩溃,白银也会如此。
“大钱”不在乎经济状况或失业状况——它只关心股市,以及它能从交易中赚多少钱等等。在这张图表上我们看到,尽管银价的超买状况在最近几周已经中和,理论上它处于突破的基础位置上。但在当前价格上涨存在很大阻力,所以如果股市走弱,我们可以预期白银将会下跌。

Finally on the 6-month chart we can see that silver is at a critical juncture here, with the 50-day moving average pulling up close to the price and the 200-day, with a small potential Head-and-Shoulders top completing, so we can expect a bigger move soon.
最后,在6个月的图表中,我们可以看到银价正处于一个关键的关口,50日移动平均线向上逼近价格和200日移动平均线有一个小的潜在头肩顶已经完成,所以我们可以预期不久会有更大的波动。

End of update.
更新结束。
作者: Clive Maund
(文章来源:https://silverseek.com/ | 翻译:中国白银网)